Local dashboard
Reached over the node's own WiFi hotspot at 10.42.0.1, within a few metres of the node.
For installation, first tests, maintenance and any check that must work when the node is offline.
Operation
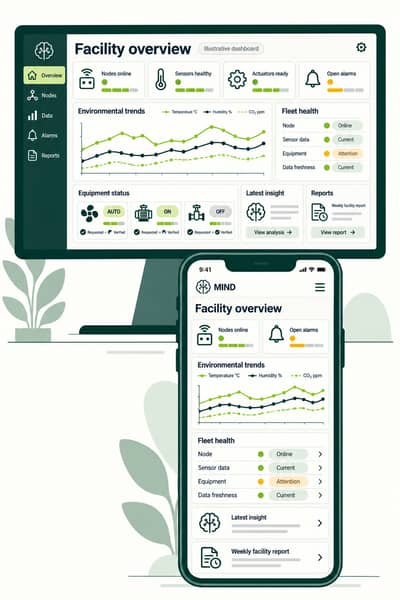
MIND AIoT gives you two views of the same node: a local dashboard on site and a cloud dashboard from anywhere. Use the local view during installation and service, and the cloud view for day-to-day monitoring.
Reached over the node's own WiFi hotspot at 10.42.0.1, within a few metres of the node.
For installation, first tests, maintenance and any check that must work when the node is offline.
Reached over the internet at app.mannamind.ai, from anywhere.
For history, configuration, alarms, analytics and reports across one node or many.
Changes to sensors, equipment and behaviour are made in the cloud dashboard and reach the node when it is online.
Keep the site's timezone and location correct. They affect timestamps and any weather-related analysis.
If a channel does not switch its device, the fault is between the controller, the relay and the equipment wiring. Stop and fix it before leaving the node in automatic operation.
Alarms tell you when something needs attention instead of waiting for you to notice a graph. Configure them in the cloud dashboard.
| Alarm | What it detects |
|---|---|
| Connection | The cloud stops receiving updates from the node. This usually means the node or the site has lost power. |
| Climate | A measured value leaves the limits you set. |
| Sensor | A sensor stops reporting. |
| Power | Unusual consumption compared with normal operation. |
Start with connection and climate alarms and add the others once you know the site's normal behaviour. Add the people who should be contacted for each node.
Beyond alarms, ask the questions your operation raises. Agents analyse the stored data and produce the answer as a view or a report.
Describe the report you want in the same way you described the behaviour during setup. Availability of individual report features is agreed for the project. Data export and API access are part of the platform's development and are confirmed for each installation.